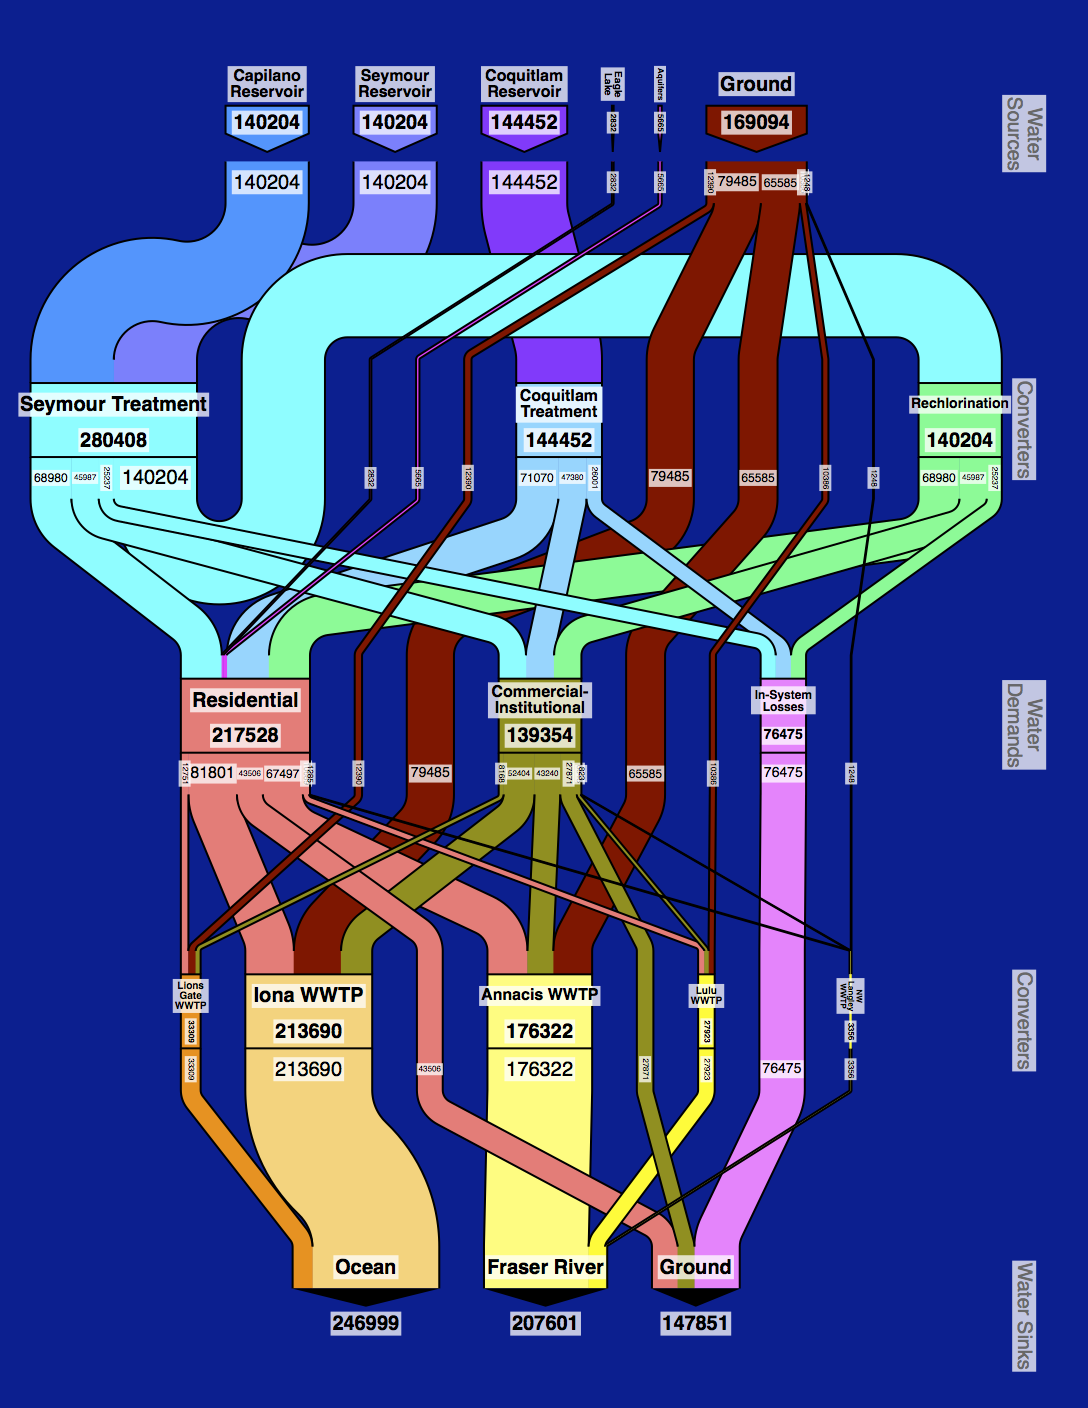
Water System Metro Vancouver ML per Year
This water diagram for the Metro Vancouver region shows a breakdown of water sources, treatment plants, and waste water treatment plants. On the other hand, the water demands are summarized; for example, there is a single junction representing all residential uses. Such a breakdown is useful to highlight water facilities management issues.
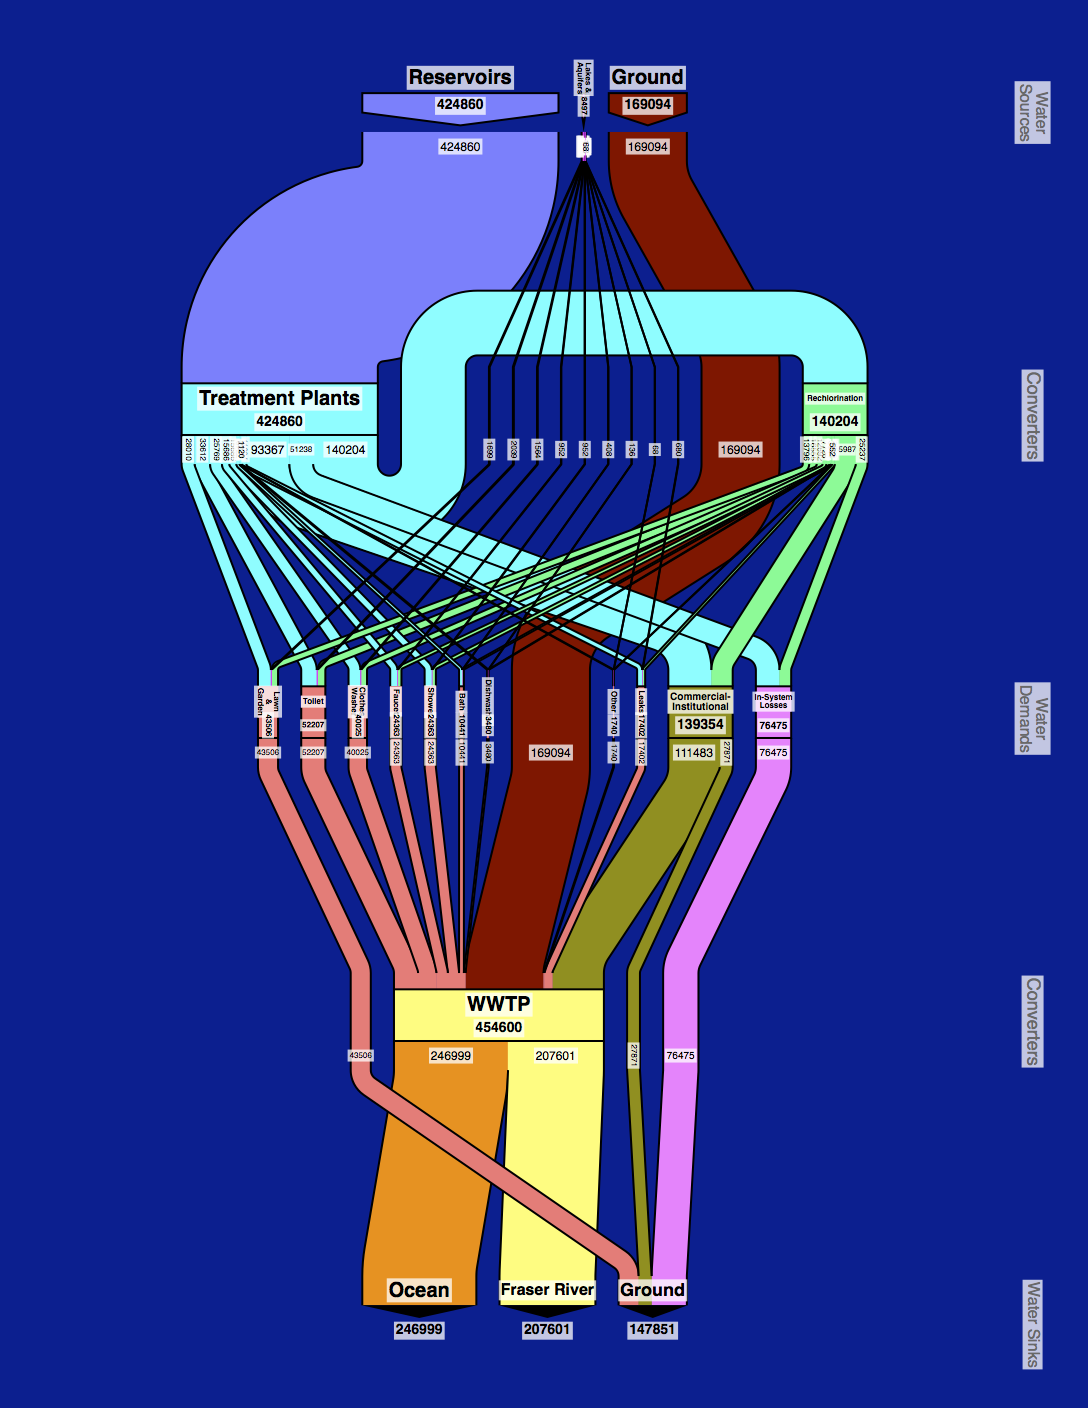
Water Residential Metro Vancouver ML per Year
This water diagram for the Metro Vancouver region shows a breakdown of residential uses. On the other hand, the water facilities are summarized; for example, there is a single junction representing all reservoirs. Such a breakdown is useful to highlight issues with water consumption in the home.
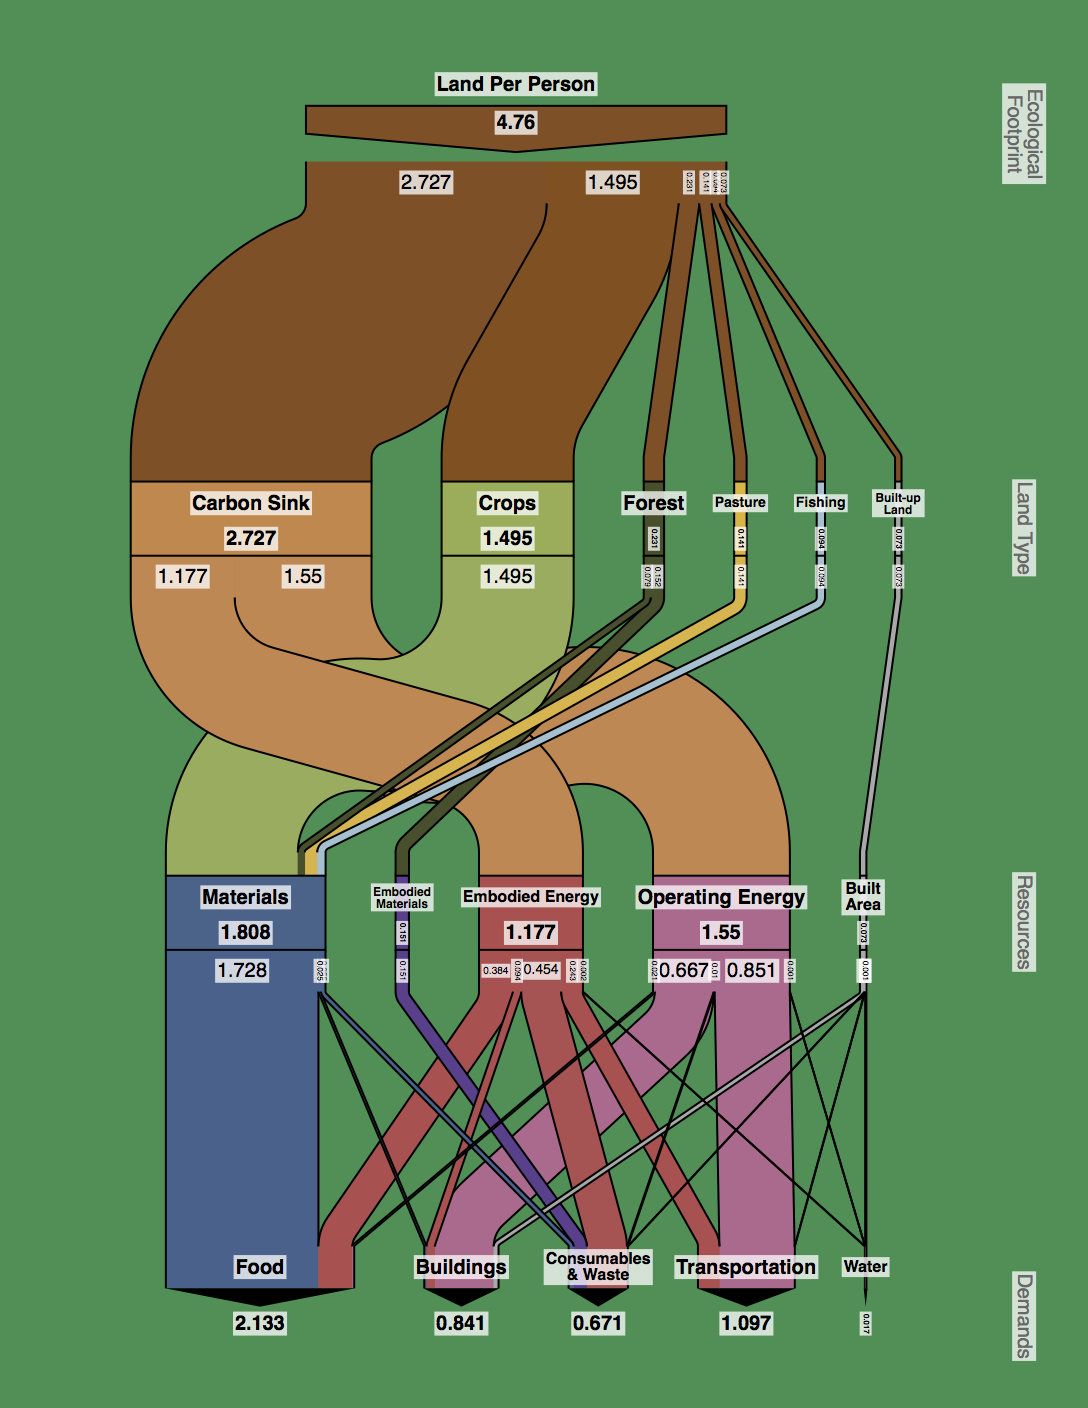
Ecological Footprint Metro Vancouver gha per Person
Above is an ecological footprint diagram for the Metro Vancouver region, in units of global hectares per capita. It shows the provenance of each person's ecological footprint, including the total footprint, the type of land needed, the resources drawn from that land, and the uses to which those resources are put. The diagram depicts results from the following paper:
An urban metabolism and ecological footprint assessment of Metro Vancouver, J. Moore, M. Kissinger and W.E. Rees, J. Environmental Management 124 (2013), pp 51-61.
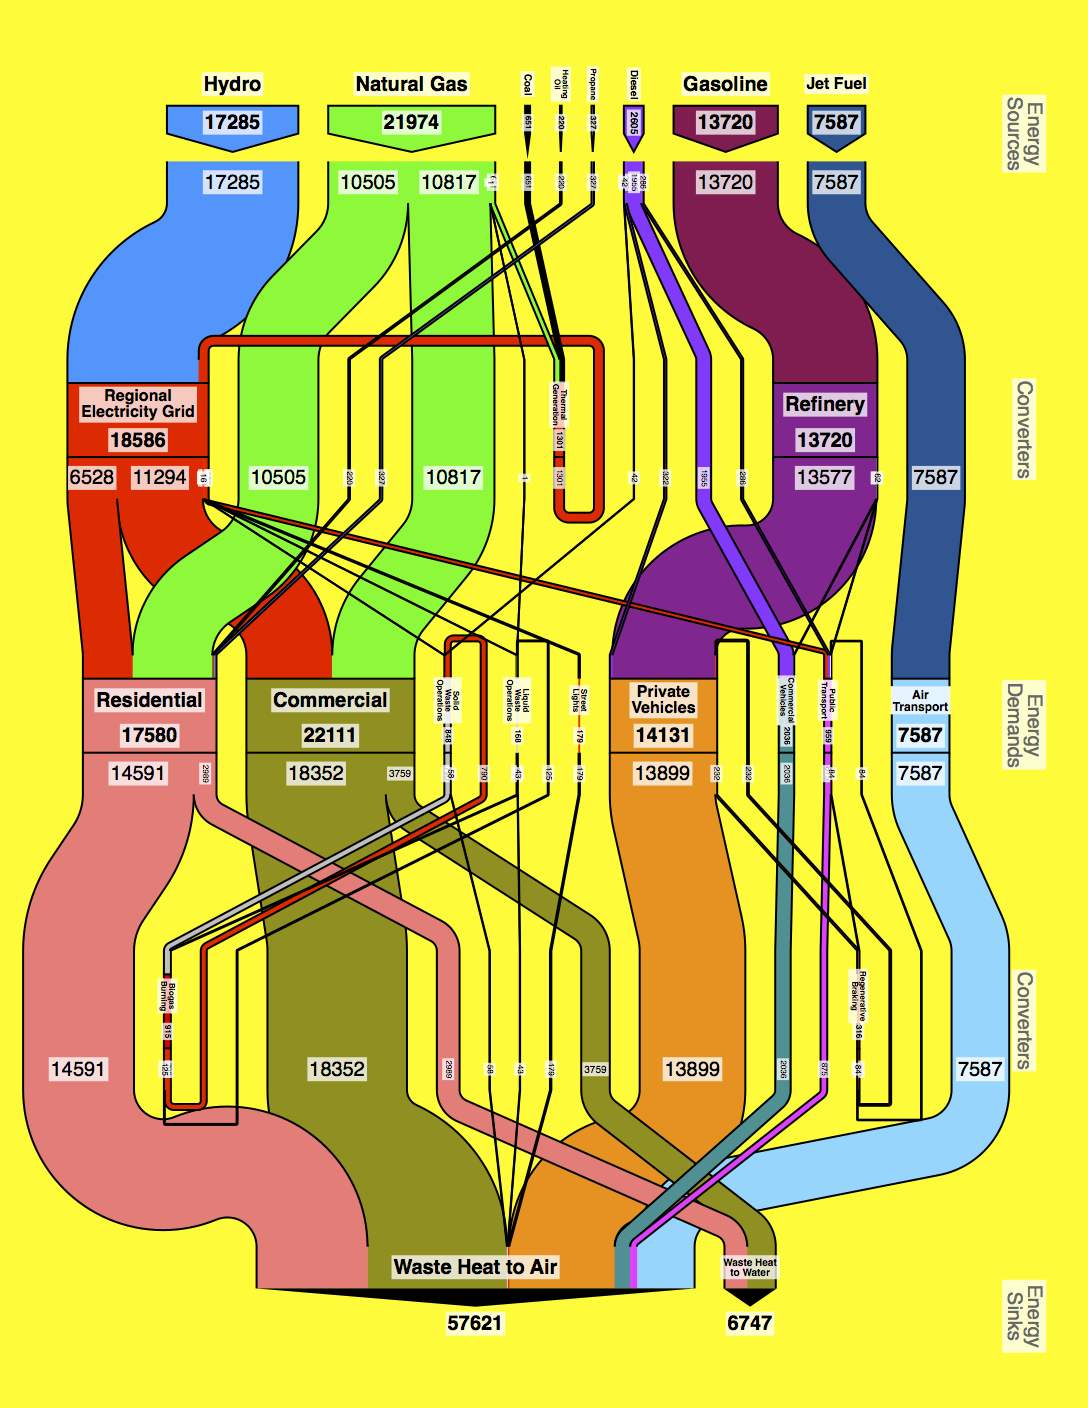
Energy Vancouver City TJ per Year
This diagram shows a comprehensive accounting of energy sources, sinks, converters and demands in the City of Vancouver. It can help planners to identify the best strategy to move toward more renewable energy sources and greater efficiencies in energy use.
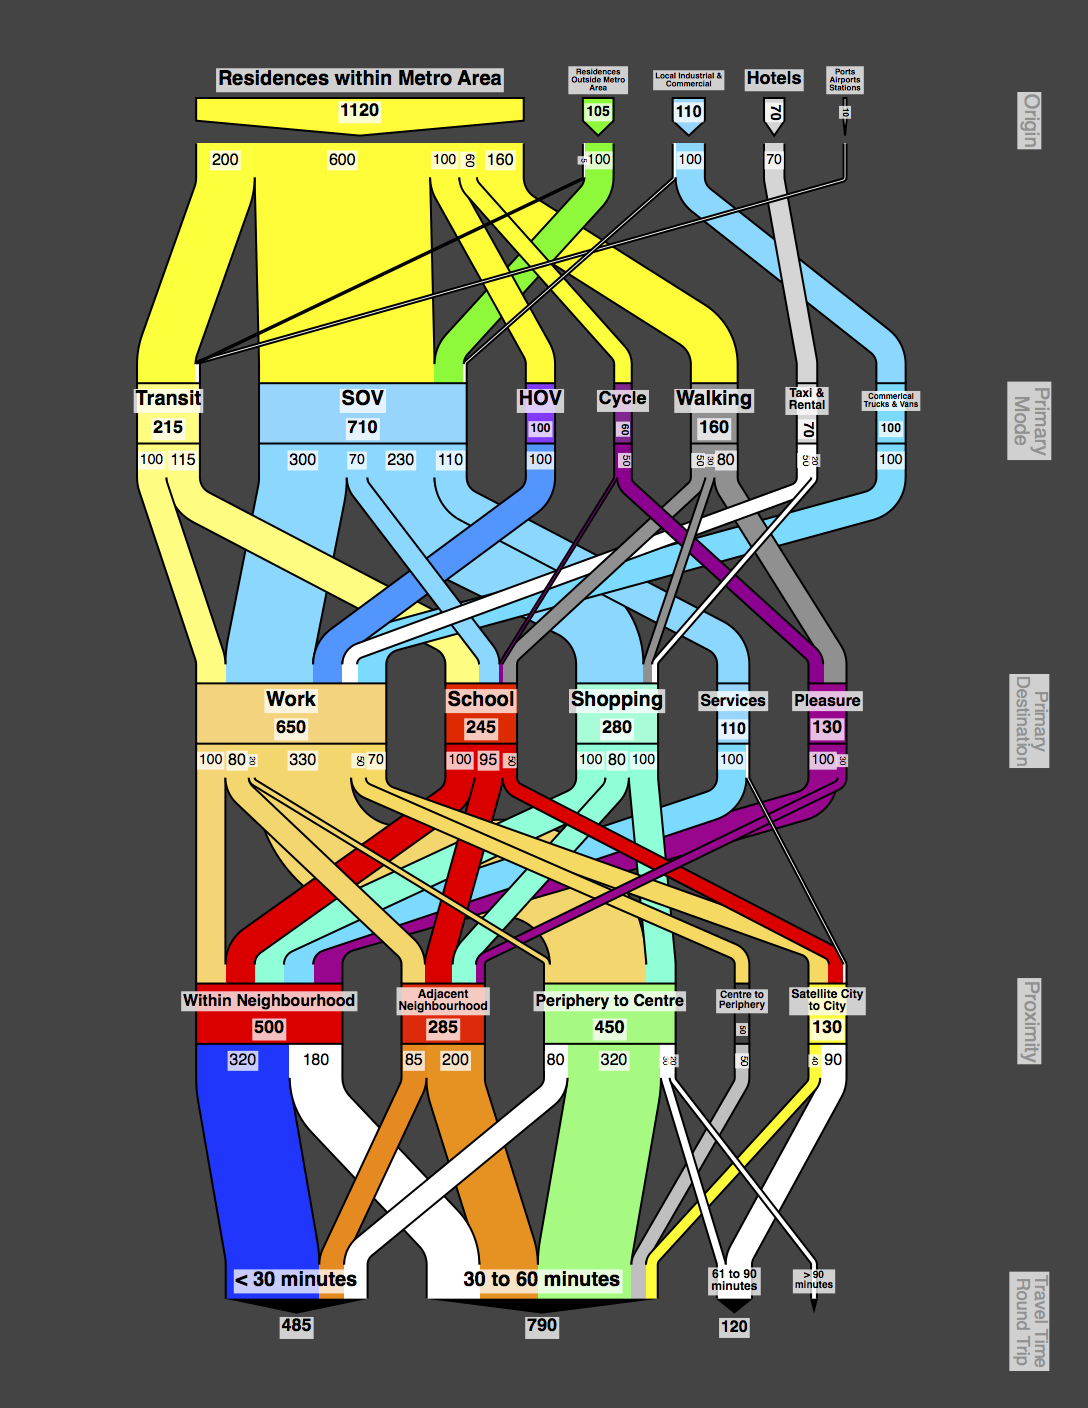
Transport Metro Example in Thousands of Daily Round Trips
This transportation example shows a template with prototypical numbers rather than real-world data. By using a common template in a number of regions, the resulting diagrams can be compared more effectively, and the results can be more easily combined into aggregate diagrams.