We Draw Your Data ... Automatically!
You live in the information age, and you need to make sense of all that information. We create and customize software to help you do just that. Our data visualization software takes your data as input and automatically generates interactive diagrams to help you understand and act upon your data. Check out our products for details, or play with some example diagrams in our gallery.
Contact us if you are interested in a site licence for our software, or in getting a quote for custom work.
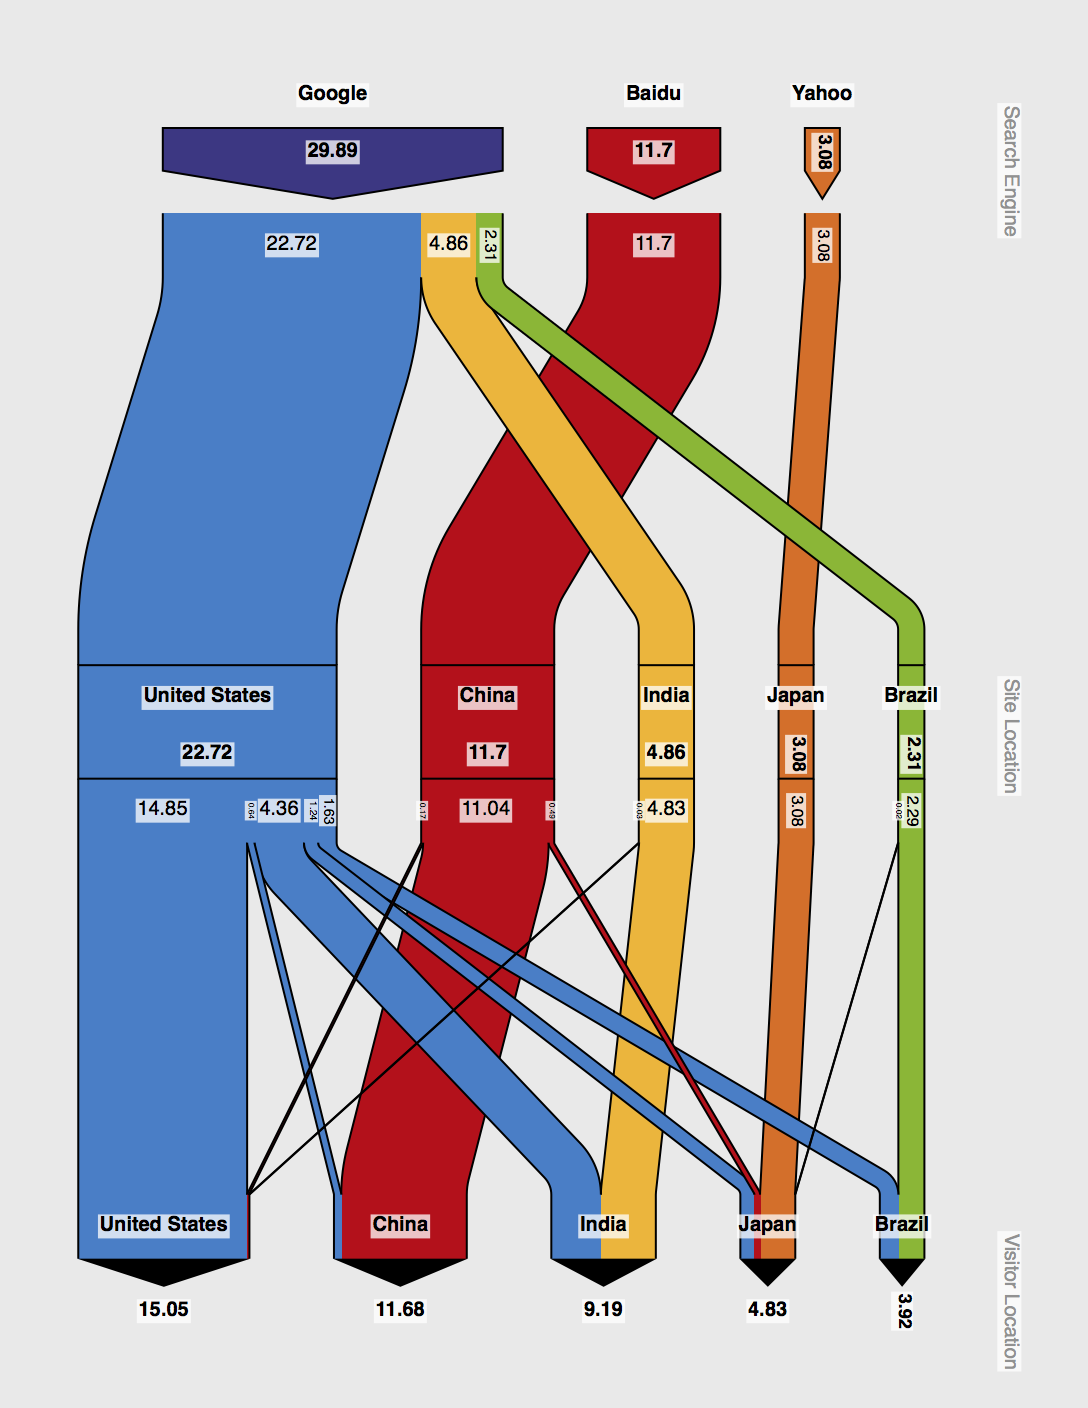
Below is a simple example to whet your appetite. It demonstrates a specific visualization of Internet traffic, using data from http://www.alexa.com.